What is an audiogram?
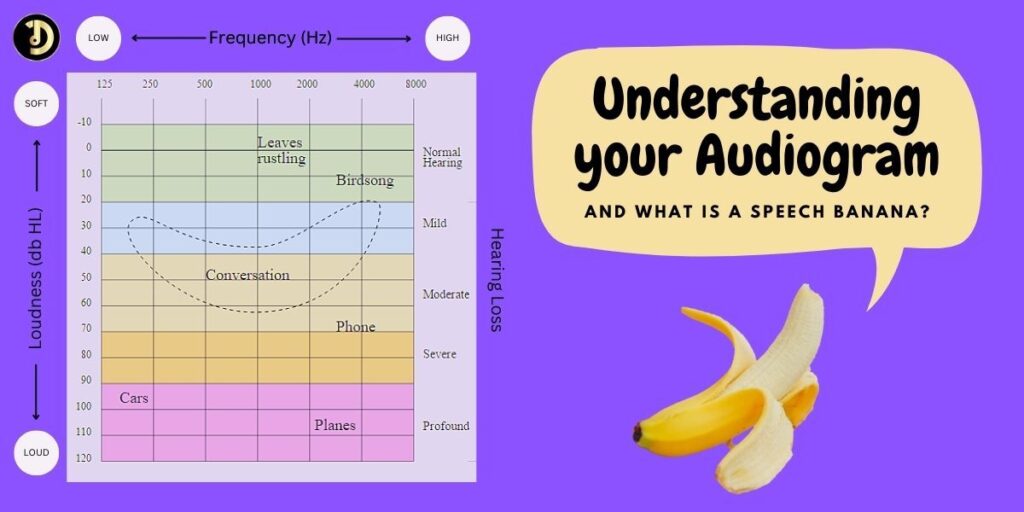
An audiogram is a chart that shows how well a person can hear different sounds. It helps doctors and other healthcare professionals understand how your hearing is working. See below for an example audiogram, showing where some everyday sounds might occur.
What is a good audiogram?
A normal hearing level on an audiogram is indicated by the results across all frequencies (left to right) being between the ranges of 0 to 25 decibels (dB).
What is an abnormal audiogram?
An abnormal audiogram shows results from a hearing test where someone has hearing below the normal range at any point across the different frequencies. This doesn’t necessarily mean the hearing loss is permanent or require hearing aids, however it is dependant on the results overall and particularly whether the ability to hear speech is affected.
Where to get an audiogram?
To get an audiogram, you have to sit a hearing test. You will need to seek an audiologist or request a referral to one by your GP. Health professionals / doctors who specialise in ears and hearing matters are called audiologists.
What is a hearing test?
What happens during a hearing test? A hearing test is done by sitting in a quiet room and listening to different sounds. These can be beeps or words, at different frequencies and volumes and then informing the audiologist when the sounds have been heard. The audiologist then notes down the results on the audiogram (chart).
Why is an audiogram done?
The audiogram shows the loudness and pitch (highness or lowness) of the sounds that you can hear. It also shows which ear is better at hearing different sounds and also the type of hearing loss you may have. This information helps the audiologist know if you have a hearing problem and how they may be able to help you hear better.
However, following your hearing test you may not receive an explanation of your audiogram itself. If you have been left wondering ‘what does my audiogram mean?’ then hopefully this will help. An audiogram offers a lot of insight into your hearing.
Audiogram interpretation and how to read your audiogram
- It is a graph that shows a person’s hearing abilities at different frequencies or pitches.
- The horizontal axis (left / right) represents the frequencies, usually measured in Hertz (Hz), and the vertical axis (up / down) represents the intensity or volume of the sound, measured in decibels (dB).
- Audiogram symbols – the right ear is represented by circles and the left ear is represented by crosses.
- There are three main types of hearing loss that can be identified on an audiogram: conductive, sensorineural and mixed hearing loss. There are others.
- Conductive hearing loss is caused by a problem in the outer or middle ear and is indicated by a shift in the plotted points towards the lower end of the vertical axis.
- Sensorineural hearing loss is caused by damage to the inner ear or auditory nerve and is indicated by a shift in the plotted points towards the higher end of the vertical axis.
- Mixed hearing loss is a combination of conductive and sensorineural hearing loss and is indicated by a shift in the plotted points towards both the lower and higher ends of the vertical axis.
The ‘O’ symbols mark the softest sounds you can hear with your right ear (in red for ‘right’).
The ‘X’ symbols mark the softest sounds you can hear with your left ear (in blue for ‘left’).
But there is often another symbol on the audiogram. It usually looks like a ‘<’ or a ‘>’ depending on the ear (it will be red or blue accordingly). These symbols will be on your audiogram when the audiologist also used a little vibrator, called a bone conductor, behind your ear to test your hearing. Audiologists use this to tell if your hearing loss is caused by a damaged nerve or because of the sound not getting through the middle ear as well as it should. If there isn’t much of a gap between the O or X and the < >, then the hearing loss is due to the hair cells in the cochlea being damaged. That is a sensorineural loss. If there is a gap, then it is due to the middle ear not working as well as it should. We call that a conductive loss. Sometimes it could be both sensorineural and conductive and will be referred to as ‘mixed’ hearing loss.
So your audiogram will be very specific to your hearing loss. For example, a conductive hearing loss audiogram will appear very different to a sensorineural hearing loss audiogram. If you require further explanation, it is wise to get professional audiogram interpretation. Your audiogram results will be unique to you as this is simply a guide.
It’s important to note that the results on an audiogram are based on the ability to hear pure tones in a quiet environment, and may not necessarily reflect how well you can hear in real-life situations – which is often very different!
Can I have an audiogram with tinnitus?
Yes you can. It is important if you experience tinnitus, to inform your audiologist of this, so that they can use techniques to help ensure that your results are as accurate as they can be.
The speech banana
So you’ve had your hearing test / audiogram and may be wondering what is the shaded area on your audiogram?
If you have a shaded area on your audiogram is it representation of the speech banana.
What is a speech banana?
This is often not shown on your audiogram but it is a shaded area represented like a banana as on the audiogram examples picture at the top of this article. It is helpful having the speech banana explained to you by your audiologist when you have your results. I know that I reached quite an age before I was even made aware of it and it would have been so helpful / validating to understand why I couldn’t understand certain things from a younger age!
Speech banana definition
The speech banana, also known as the speech reception threshold (SRT) curve, is a representation of the ability to understand speech. It is called a speech banana because of the shape it inhabits on an audiogram. It’s not clear who invented the term ‘speech banana’ but the term has been documented in audiology literature since at least the 1970’s.
The speech banana is shaped like a banana with the narrow end representing the low pitches and the wide end representing the high pitches. The top of the curve represents the minimum volume at which a person can understand speech, and the bottom of the curve represents the maximum volume at which a person can understand speech. The closer the curve is to the top of the graph, the better a person’s ability to understand speech at that pitch. The whole area, the banana shape, represents the sounds present in average conversational speech as shown in the above picture example of audiogram.
What is the speech banana used for?
The speech banana is an important part of the audiogram because it helps to identify any potential issues you may have with speech understanding or comprehension. If the speech banana is significantly lower than the audiogram, it may indicate that you are having difficulty understanding speech, even if you can hear the sounds being made. This can be caused by a variety of factors, including damage to the auditory nerve or problems with the brain’s ability to process and interpret sound.
It is helpful to have the speech banana and its interpretation explained for you. Importantly, if you are still unsure about what your audiogram results mean for you, go back to an audiologist and ask them. Information is key in understanding your personal hearing or lack of, and it can help you to make your own informed decisions about how best to manage communication and day to day activities.
Below is an illustrative audiogram showing both the speech banana and where you may typically find everyday familiar common sounds on an audiogram:
Above shows where you may typically find common everyday familiar sounds and noises on an audiogram
Our deaf network is made up of people with many different types and causes of deafness and hearing loss – and thanks to our diversity we share and learn ways to adapt together! Join us today!